QoS Dashboard
The QoS Dashboard presents a snapshot of the Quality of Service Policies active within the network, it lists the QoS Alert Rate, and a set of widgets that display the status of Top QoS Status by, Input Bandwidth, Output Bandwidth, Input Drops by Bitrate, Output Drops by Bitrate, and Application Bandwidth. Within each widget the order can be displayed from Highest to Lowest, or vice-a-versa by clicking on the title bar within each widget.
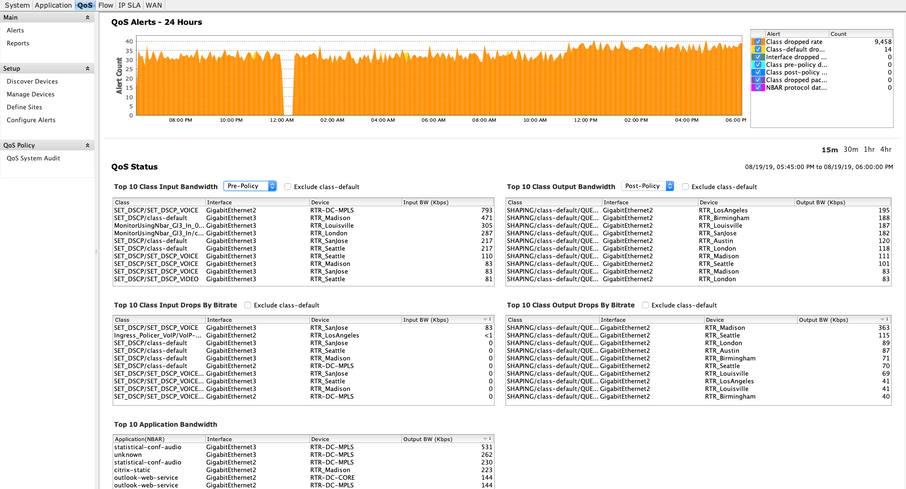
The QoS System Audit in the Action menu will open the Policy and Performance Audit Report which is covered later in this chapter. Right-clicking on any of the widgets will give the user the option to view the Pre- and Post-Policy graphs for the policy selected.